
Download TCPView for Windows
Monitor every TCP and UDP connection on your system in real time. See which processes own each connection, with color-coded status updates every second.
What Is TCPView?
A real-time network connection monitor from Microsoft Sysinternals that gives you full visibility into every TCP and UDP endpoint on your Windows PC.
Real-Time Network Visibility
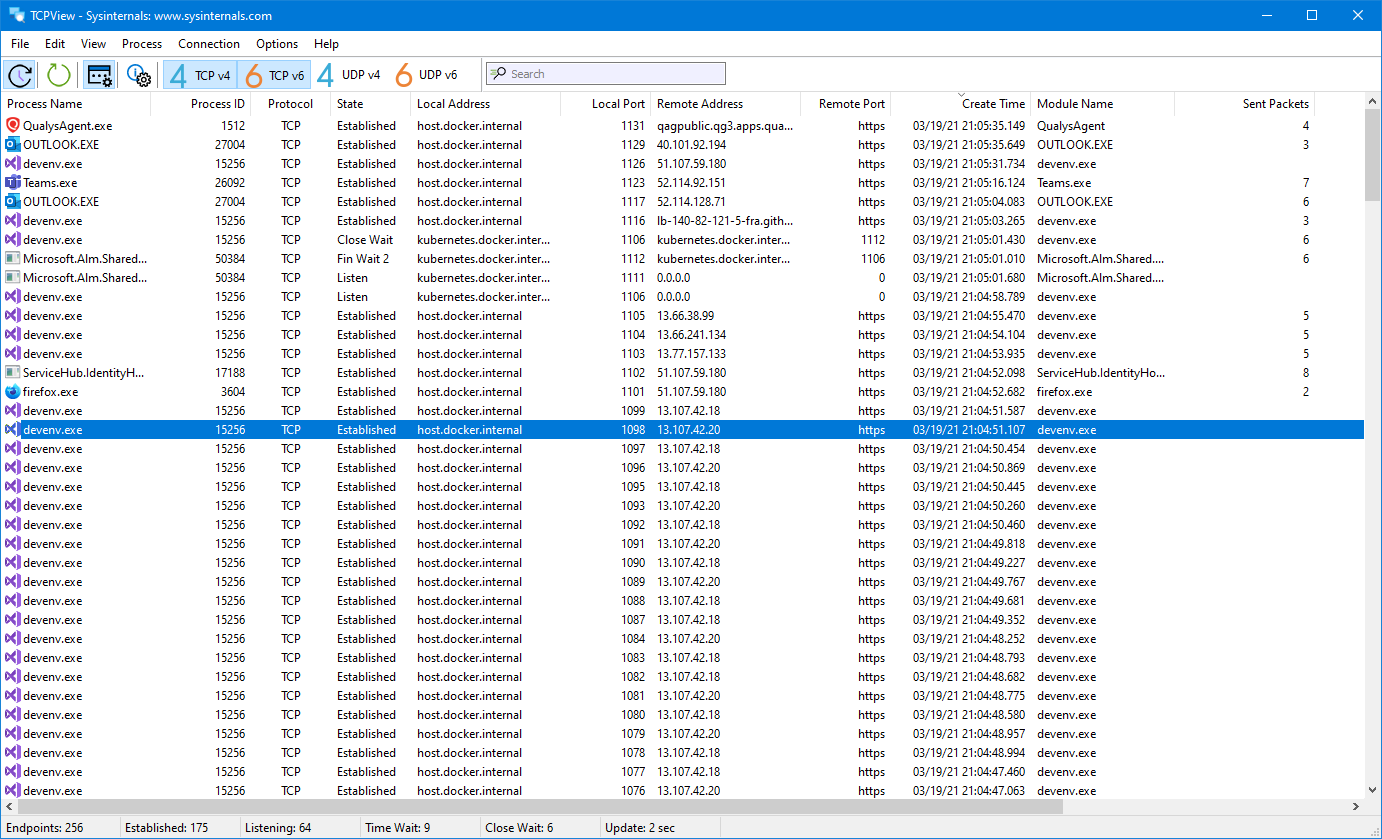
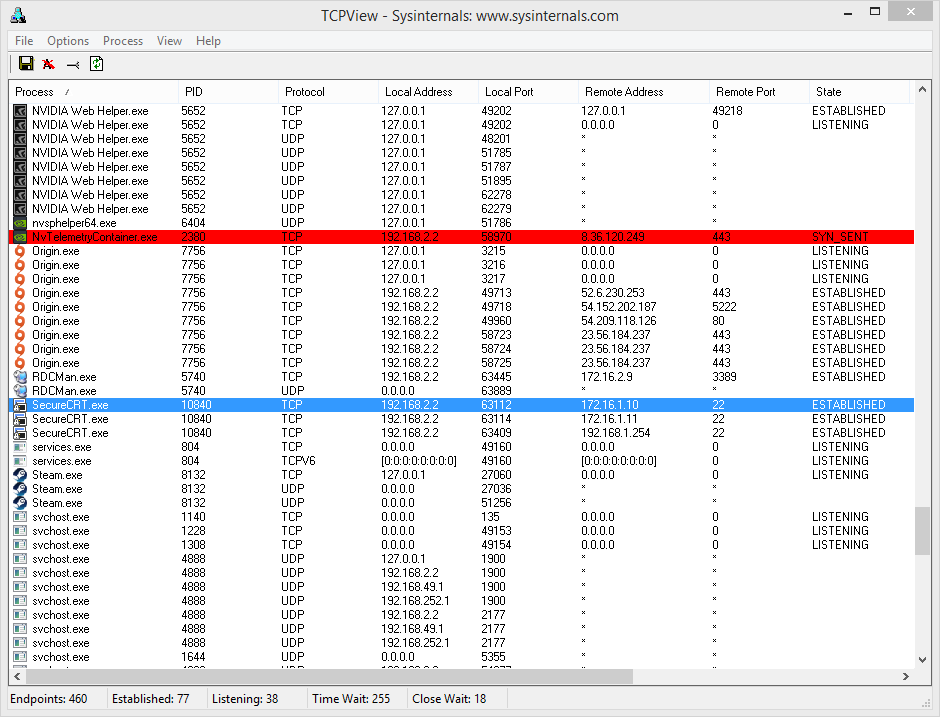
TCPView is a free Windows utility developed by Mark Russinovich as part of the Microsoft Sysinternals suite. It shows every active TCP and UDP endpoint on your system, updating the display once per second by default. Each row in the main table tells you which process owns the connection, the local and remote addresses involved, port numbers, and the current connection state. If you have ever used the netstat command and wished the output would just stay up to date on its own, TCPView is the visual answer to that.
Who Uses TCPView?
System administrators rely on the TCPView tool to audit which services are listening on a server. Network engineers use it to trace unexpected outbound connections. Security analysts run TCPView to spot suspicious traffic from unknown processes. Developers turn to it when debugging socket-level issues in their own applications. It works on Windows 8.1 through Windows 11 and on Windows Server 2012 and later, so it covers most production and desktop environments still in active use.
How It Works
When you launch TCPView, it immediately enumerates every endpoint registered with the Windows networking stack. New connections appear as green-highlighted rows. Connections that close turn red for a brief moment before disappearing. State changes—like a socket moving from SYN_SENT to ESTABLISHED—flash yellow. This color coding makes it easy to spot activity without reading every column. You can right-click any row to close a connection, kill the owning process, or run a Whois lookup on the remote address. The included Tcpvcon command-line companion gives you the same data in a scriptable format for automation or logging.
The entire package weighs in at roughly 1.5 MB as a ZIP archive containing both 32-bit and 64-bit builds. No installation is required. Extract the ZIP, run tcpview.exe, and the interface is ready within seconds. Because it runs as a portable app, TCPView is a favorite tool for USB-based admin toolkits that IT staff carry from machine to machine.
Ready to monitor your network? Download TCPView or jump to the full feature breakdown.
Key Features
TCPView gives you a live, color-coded view of every network connection on your Windows machine. Here is what makes it a go-to tool for sysadmins and network troubleshooters.
Real-Time Endpoint Monitoring
TCPView refreshes its connection list every second by default, so you see new connections the moment they appear and closed ones the instant they drop. You can adjust the refresh interval or pause updates entirely when you need to examine a specific snapshot. Unlike running netstat over and over in a terminal, TCPView streams changes directly to a sortable table that stays current without any manual effort.
Color-Coded Connections
Green rows flag newly opened connections. Red marks ones that just closed. Yellow highlights state changes. This color system lets you spot suspicious or unexpected activity at a glance without reading every line of output.
Process-Level Visibility
Every row ties a connection back to the process that owns it, showing the executable name and PID. If an unfamiliar process is reaching out to a remote server, you will know immediately. Right-click any row to jump to process properties or terminate it.
Close Connections Directly
TCPView lets you shut down individual TCP connections from the context menu. If a stuck connection is blocking a port or a rogue process is calling home, you can sever it without restarting the service or rebooting the machine. You can also kill the owning process entirely from the same menu.
Built-In Whois Lookup
Right-click any remote address and run a Whois query without leaving the application. This tells you who owns that IP, which organization registered it, and where it is geographically. Useful for verifying whether outbound traffic is heading to a legitimate server or somewhere unexpected.
DNS Name Resolution
Toggle address resolution with Ctrl+R to switch between raw IP addresses and resolved hostnames. Seeing google.com instead of 142.250.80.4 makes it easier to understand where traffic is going. Disable resolution if you want faster refresh times or prefer working with numeric addresses.
Sent and Received Traffic Tracking
TCPView tracks the number of packets and bytes sent and received per connection. You can sort by these columns to quickly find the most bandwidth-hungry connections on your system. This is particularly helpful for diagnosing performance issues or identifying processes that transfer large amounts of data in the background. The data columns update in real time alongside connection states.
Export Connection Data
Save the current connection snapshot to a file for documentation, incident response, or comparison later. The export captures every column visible in the table, so you keep a complete record of what was connected, when, and how much data was exchanged.
IPv4 and IPv6 Support
TCPView lists TCPv6 and UDPv6 endpoints alongside their v4 counterparts. As more networks adopt IPv6, having both protocols visible in one view means you do not need a separate tool to monitor dual-stack environments.
Tcpvcon Command-Line Companion
The download includes Tcpvcon, a command-line version of TCPView that you can use in scripts, scheduled tasks, or remote sessions where a GUI is impractical. Pipe its output to a log file or combine it with PowerShell for automated monitoring.
No Installation Required
TCPView is fully portable. Unzip, double-click, and it runs. No installer, no registry changes, no dependencies to worry about. Carry it on a USB drive and run it on any Windows machine from 8.1 through 11 without leaving a trace.
Connection Filtering
Filter the list to show only established connections, cutting through the noise of listening and waiting states. When you are tracking down an active issue, filtering strips away the entries you do not care about and lets you focus on live traffic.
Ready to monitor your network? Download TCPView and start watching connections in real time.
System Requirements
TCPView runs on most modern Windows systems with minimal hardware demands. Here is what you need to get started.
| Component | Minimum | Recommended |
|---|---|---|
| Operating System | Windows 8.1 or Windows Server 2012 | Windows 10 (version 1903+) or Windows 11 |
| Processor | Any x86 or x64 CPU (1 GHz+) | Dual-core processor, 2 GHz or faster |
| RAM | 512 MB available | 2 GB or more for busy systems with many connections |
| Disk Space | 10 MB free (portable app, no install needed) | 50 MB free including extracted files and logs |
| Display | 1024 × 768 resolution | 1280 × 720 or higher for full column visibility |
| Permissions | Standard user (limited feature set) | Administrator privileges for full access |
| Network | Not required for basic operation | Active connection for DNS resolution and Whois lookups |
Ready to get started? Download TCPView or check the getting started guide.
Download TCPView
Get the latest version of TCPView directly from Microsoft Sysinternals. No installer needed – just extract and run.
TCPView for Windows
Version 4.19 · ZIP Archive · 1.5 MB
Download TCPViewWindows 8.1 / 10 / 11 · 32-bit & 64-bitWhat You Get
- TCPView.exe – the main GUI application with real-time connection monitoring
- Tcpvcon.exe – command-line companion for scripts and automation
- Portable – no installation required. Extract the ZIP and double-click TCPView.exe to start
- Signed by Microsoft – digitally signed binary, safe to run on any Windows machine
- Admin optional – runs without elevation, but admin rights reveal all system connections
TCPView downloads directly from download.sysinternals.com, the official Microsoft Sysinternals distribution server.
Need help after downloading? Check our Getting Started guide.
Screenshots
See TCPView in action – real interface screenshots showing network monitoring, connection management, and configuration options.
Getting Started with TCPView
From download to your first network scan in under five minutes. This walkthrough covers everything you need to start monitoring connections on Windows.
Head to our download section above to grab the latest version of TCPView. The download is a single ZIP archive weighing in at roughly 1.5 MB, so it should finish in seconds even on slower connections.
The ZIP file bundles both the 32-bit and 64-bit builds together, which means you do not need to pick one or the other before downloading. Inside the archive you will find Tcpview.exe (the graphical application) and Tcpvcon.exe (a command-line companion that produces the same connection data in text format). There is also a copy of the Sysinternals EULA.
Portable by Design
TCPView does not ship as an installer (.exe setup wizard or .msi package). It is a fully portable application. That means there are no registry entries, no background services, and nothing to uninstall later. You extract the files, run the program, and you are done. If you want to remove it, just delete the folder. This makes TCPView a good fit for USB toolkits and shared admin machines where you do not have permission to install software.
C:ToolsSysinternals for TCPView and other Sysinternals utilities. Keeping them in one place makes it easy to add the folder to your system PATH and launch any tool from a command prompt.
Since TCPView is portable, there is no traditional installation process. Here is exactly what to do after the download finishes:
- Locate the ZIP file in your Downloads folder. It will be named something like
TCPView.zip. - Right-click the ZIP and choose Extract All… (built into Windows 10 and 11). Pick a permanent location such as
C:ToolsTCPViewrather than leaving files on your Desktop. - Open the extracted folder. You will see
Tcpview.exe,Tcpview64.exe(on older builds),Tcpvcon.exe, and the EULA text file. - Double-click Tcpview.exe to launch. On the first run, a Sysinternals license agreement dialog appears. Read through the terms and click Agree to continue. You only need to accept this once.
Windows SmartScreen Warning
If Windows SmartScreen shows a blue popup saying “Windows protected your PC,” click More info and then Run anyway. This happens because the executable is downloaded from the internet and is not code-signed with an EV certificate in some ZIP distributions. The file is safe — it comes directly from Microsoft.
Running as Administrator
TCPView works without admin rights, but some features require elevation. To see sent/received byte counters for every process and to close connections owned by system services, right-click Tcpview.exe and choose Run as administrator. Without elevation, certain process details may appear blank.
lsof, ss, or netstat on those platforms.
Sysinternals Live (No Download Needed)
If you want to run TCPView without saving any files to disk, Microsoft offers Sysinternals Live. Open a Run dialog (Win+R) and type:
This streams the executable directly from Microsoft’s servers. It requires an active internet connection and may be slightly slower to launch, but it is useful on locked-down machines where you cannot extract ZIP files.
TCPView launches with sensible defaults, but a few quick adjustments will make the display much more useful for day-to-day monitoring.
Refresh Rate
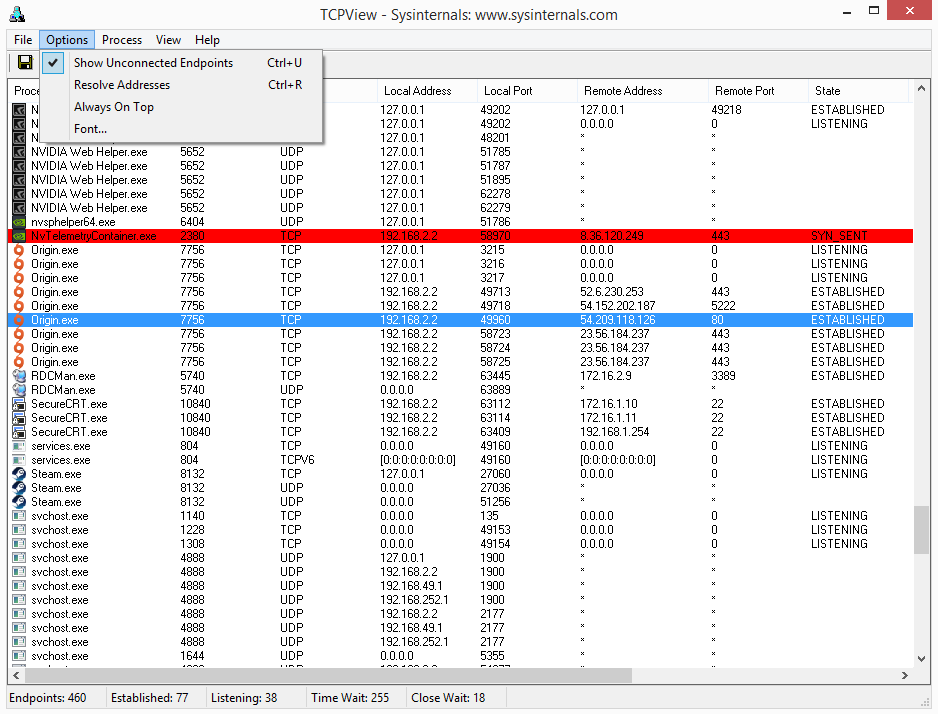
By default, TCPView refreshes every 1 second. For most troubleshooting sessions that is fine, but on busy servers with hundreds of connections the constant updates can be hard to follow. Go to Options > Refresh Rate and try 2 seconds or 5 seconds if the display flickers too much. You can also choose Paused to freeze the view and press F5 to refresh manually when you are ready.
Address Resolution
TCPView resolves IP addresses to hostnames by default, which is helpful for identifying remote servers. If resolution is causing delays or you prefer raw IPs, toggle it off with Ctrl+R or click the address resolution icon (the “A” button) in the toolbar. Disabling resolution also speeds up the display on systems with many endpoints.
Filter Connected Endpoints
The default view shows everything: listening sockets, established connections, and UDP endpoints. To focus on active connections only, press Ctrl+U or use the toolbar toggle. This hides all LISTENING and unconnected UDP rows, leaving just the endpoints that are exchanging data.
Column Visibility
Go to View in the menu bar. You can toggle column groups for sent/received packets, sent/received bytes, and connection state visibility. If you are tracking bandwidth usage, make sure the Sent Packets, Recv Packets, Sent Bytes, and Recv Bytes columns are enabled.
With TCPView open, you are already looking at live data. Every row in the main table represents a single network endpoint on your system. Here is how to read and act on what you see.
Understanding the Color Codes
TCPView uses three highlight colors that appear briefly when connection states change:
- Green rows — A new connection just appeared. This could be a browser opening a new tab, a background service phoning home, or a download starting.
- Yellow rows — An existing connection changed state. For example, a connection moving from SYN_SENT to ESTABLISHED.
- Red rows — A connection just closed. It will vanish from the list after a few refresh cycles.
These highlights stick around for about three refresh intervals before the row returns to its normal color or disappears entirely.
Investigating a Suspicious Connection
Suppose you spot an unfamiliar process making outbound connections on port 443. Here is what to do:
- Click the row to select it. Note the Process name and PID in the first two columns.
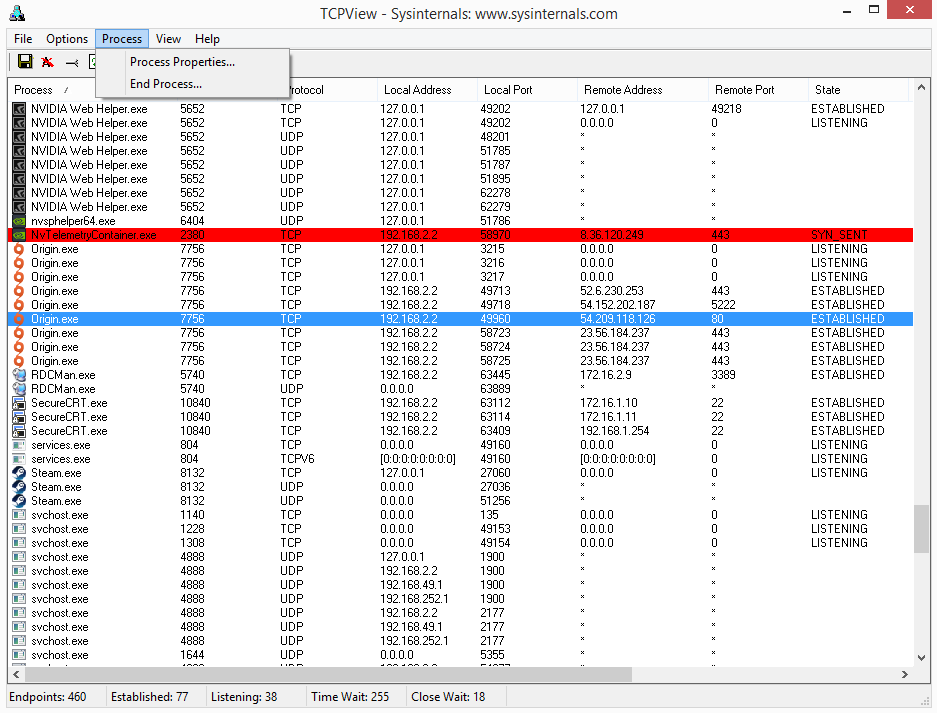
- Right-click and choose Process Properties to see the full file path of the executable. This tells you exactly which program owns the connection.
- Right-click again and select Whois… to look up the remote IP address. The Whois result shows the registered owner (often a CDN like Cloudflare, Akamai, or a known service provider).
- If the connection looks malicious, right-click and choose Close Connection to terminate it immediately, or End Process to kill the entire application.
Keyboard Shortcuts Reference
| Shortcut | Action |
|---|---|
| F5 | Manual refresh (useful when paused) |
| Ctrl+R | Toggle DNS name resolution on/off |
| Ctrl+U | Show connected endpoints only |
| Ctrl+S | Save connection list to a text file |
| Ctrl+C | Copy selected row details to clipboard |
| Ctrl+A | Select all rows |
Using Tcpvcon (Command-Line)
For scripting and automation, the bundled Tcpvcon.exe works from Command Prompt or PowerShell. Basic usage:
The flags: -a shows all endpoints (listening + connected), -c outputs comma-separated format, and -n skips DNS resolution for faster results. You can also filter by process name or PID:
This lists only endpoints owned by Chrome, which is handy for isolating a single application’s network activity.
Performance on Busy Systems
Servers running dozens of services can generate hundreds of endpoints. If TCPView feels sluggish, set the refresh rate to 5 seconds, disable address resolution (Ctrl+R), and filter to connected endpoints only (Ctrl+U). These three changes together reduce CPU usage significantly.
Common Beginner Mistakes
- Panicking over LISTENING ports — Seeing dozens of ports in LISTENING state is normal. These are services waiting for incoming connections. Only worry if you spot an unexpected process listening on an unusual port.
- Closing connections recklessly — Do not close connections for processes you do not recognize without checking their file path first (right-click > Process Properties). Many legitimate Windows services use generic names.
- Forgetting to run as admin — If sent/received byte counters show all zeroes or the columns appear blank, you are likely not running with elevated privileges.
Power-User Features
- Sorting by column — Click any column header to sort. Click the Remote Address column to group connections by destination, or sort by Sent Bytes to find which process is using the most bandwidth.
- Save and compare — Use Ctrl+S to save snapshots at different times. Open both files in a diff tool to see which connections appeared or disappeared between captures.
- Combine with Process Explorer — Right-click a row and choose Process Properties. If you have Process Explorer installed (another Sysinternals tool), it provides deeper details like DLLs loaded, handles, and thread activity for the selected process.
- Tcpvcon in scripts — Schedule
tcpvcon.exe -a -c -n > log.csvvia Task Scheduler to capture periodic snapshots of your server’s network state. Great for post-incident analysis.
Staying Updated
TCPView does not auto-update. Check the download section periodically for new releases. You can also bookmark the official Microsoft Sysinternals page. Major version updates typically add new columns, protocol support, or performance improvements. Since the tool is portable, updating is simple: download the new ZIP and replace the old files.
Ready to monitor your network? Download TCPView and start scanning connections in minutes.
Frequently Asked Questions
Answers to the most common questions about downloading, installing, and using TCPView on Windows.
Is TCPView safe to download and use?
Yes, TCPView is safe. It is developed and published by Microsoft as part of the Sysinternals suite, which has been maintained by Mark Russinovich since the late 1990s and officially owned by Microsoft since 2006.
The TCPView download (version 4.19) is a 1.5 MB ZIP file that contains digitally signed executables. Security scanners like SpyShelter and VirusTotal consistently report zero detections on the official binaries. The tool runs entirely on your local machine, does not send data to external servers, and does not modify any system files. It simply reads your operating system’s TCP/IP stack information and displays it in a window. On Windows 10 and Windows 11, SmartScreen may briefly show a warning because the executable is extracted from a ZIP rather than installed through a traditional installer, but this is normal behavior for portable utilities.
- Publisher: Microsoft Corporation, digitally signed
- VirusTotal: 0/70+ engines flag the official download
- No installation required – runs directly from the extracted folder
- Does not write to the registry or modify system settings
- Open-source Tcpvcon companion tool included in the same package
Pro tip: Always verify the digital signature by right-clicking tcpview.exe, selecting Properties, and checking the Digital Signatures tab. The signer should be “Microsoft Corporation.”
For more details about the download, visit our download section.
Is TCPView free from malware and spyware?
TCPView from the official Microsoft Sysinternals page is completely free from malware, spyware, adware, and bundled software. There is no installer that sneaks in browser toolbars or third-party programs.
The official distribution is a simple ZIP archive containing tcpview.exe (both 32-bit and 64-bit builds), the Tcpvcon command-line companion, and a EULA text file. No background services get installed, and the program does not phone home or collect telemetry. Microsoft maintains a strict policy against bundling on Sysinternals tools. The danger comes only when you download TCPView from unofficial third-party sites that might repackage the tool with adware or trojans. Sites like FileHorse, Softonic mirrors, and random download portals have been known to wrap legitimate tools in their own installers.
- Download only from the official Microsoft Learn page or our verified download link
- Check the file size – the official ZIP is approximately 1.5 MB
- Scan the download with Windows Defender or your antivirus before extracting
- Verify the digital signature matches Microsoft Corporation
Pro tip: If you want the entire Sysinternals toolkit at once, download the Sysinternals Suite ZIP from Microsoft. It includes TCPView alongside Process Explorer, Autoruns, and 70+ other utilities, all verified and signed.
Check our system requirements to confirm compatibility before downloading.
Where is the official safe download for TCPView?
The official download for TCPView is hosted on Microsoft Learn at learn.microsoft.com/en-us/sysinternals/downloads/tcpview. This is the only source maintained directly by Microsoft.
Microsoft moved the Sysinternals downloads from the old technet.microsoft.com domain to learn.microsoft.com in 2022. Some older blog posts and forum threads still reference the TechNet URLs, but they redirect automatically. The current version available on the official page is 4.19, last updated in early 2024. You can also access TCPView through the Microsoft Store or by downloading the complete Sysinternals Suite, which bundles all 70+ tools into a single ZIP file. Another safe option is Sysinternals Live, where you can run the tool directly from the web share at live.sysinternals.com without downloading anything to disk.
- Official page: learn.microsoft.com/en-us/sysinternals/downloads/tcpview
- Sysinternals Live:
live.sysinternals.comtoolstcpview.exe - Sysinternals Suite ZIP from Microsoft Learn (includes all tools)
- Microsoft Store listing (auto-updates included)
Pro tip: Use the Sysinternals Live path in a Run dialog (Win+R) to launch TCPView instantly without saving any files to your machine. Just type live.sysinternals.comtoolstcpview.exe and press Enter.
We link directly to the official source on our download page.
Does TCPView work on Windows 11?
Yes, TCPView 4.19 works on Windows 11 without any issues. It is fully compatible with all Windows 11 versions, including 23H2 and 24H2.
The tool runs natively on both x64 and ARM64 builds of Windows 11. Microsoft tests Sysinternals tools against current Windows releases, and TCPView has been updated to support the newer networking APIs in Windows 11. The interface renders correctly on high-DPI displays and scales properly when using display scaling above 100%. Some users running Windows 11 on ARM processors (like the Surface Pro with Snapdragon X) report that the x64 version runs fine through emulation, though there is also a native ARM64 build available in the Sysinternals Suite.
- Windows 11 Home, Pro, Enterprise, and Education editions are all supported
- Works on both Intel/AMD (x64) and ARM64 processors
- Compatible with Windows 11 versions 21H2 through 24H2
- Supports high-DPI scaling (150%, 200%, 250%)
- No compatibility mode or special settings required
Pro tip: Run TCPView as Administrator on Windows 11 to see the full process names and PIDs for system services. Without elevation, some system-level connections show limited information.
See the full list of supported platforms on our system requirements page.
Does TCPView support 32-bit operating systems?
Yes, TCPView ships with both 32-bit and 64-bit executables inside the same ZIP download. The 32-bit version runs on any supported Windows version from Windows 8.1 onward.
When you extract the TCPView 4.19 ZIP archive (approximately 1.5 MB), you will find separate executable files for different architectures. The file tcpview.exe is the 64-bit build, and tcpview64a.exe targets ARM64 processors. For 32-bit systems, look for the 32-bit binary in the package. The tool automatically detects your system architecture when you launch it. On a 32-bit Windows 10 installation with 2 GB of RAM, TCPView runs without any performance problems because it has minimal resource requirements and uses very little memory, typically under 15 MB even when monitoring hundreds of connections.
- 32-bit (x86) and 64-bit (x64) builds included in every download
- ARM64 build available for Windows on ARM devices
- Minimum OS: Windows 8.1 (32-bit or 64-bit) or Windows Server 2012
- Memory usage: under 15 MB in typical operation
Pro tip: If you are managing older machines still running 32-bit Windows, you can put TCPView on a USB drive since it is fully portable. No installation required – just copy the folder and run the exe.
Review the full hardware specs on our system requirements page.
Can I run TCPView on macOS or Linux?
No, TCPView is a Windows-only utility. Microsoft Sysinternals tools are built specifically for the Windows kernel and do not have official macOS or Linux releases.
TCPView reads from the Windows TCP/IP stack using native Win32 APIs, so it cannot be ported directly to other operating systems. Some users have tried running it through Wine on Linux, but results are unreliable because Wine does not fully emulate the Windows networking subsystem that TCPView depends on. For Mac and Linux users, there are native alternatives that provide similar functionality. On macOS, the built-in lsof -i command shows open network connections with process information, and on Linux, ss -tunapl gives a comparable output to what TCPView displays on Windows.
- macOS alternatives:
lsof -i -P, Activity Monitor (Network tab), or the third-party app Private Eye - Linux alternatives:
ss -tunapl,netstat -tunapl, or the GUI tool tcpview by chipmunk-sm on GitHub - Cross-platform: Wireshark works on Windows, macOS, and Linux for deeper packet inspection
- Wine compatibility: partial and unreliable, not recommended
Pro tip: If you need a GUI similar to TCPView on Linux, check out the open-source project at github.com/chipmunk-sm/tcpview. It replicates the core TCPView interface using Qt and works on most Linux distributions.
For Windows-specific features, see what TCPView offers on our features page.
Is TCPView completely free to download and use?
Yes, TCPView is 100% free. There is no paid version, no premium tier, no trial period, and no feature restrictions. You get the full tool at no cost.
Microsoft distributes all Sysinternals utilities as freeware under the Sysinternals Software License Terms (a Microsoft EULA). This has been the case since Mark Russinovich and Bryce Cogswell first created the tool in the late 1990s, and it continued after Microsoft acquired Sysinternals in 2006. There are no ads in the application, no nag screens asking you to upgrade, and no data collection that monetizes your usage. The license allows you to use TCPView for both personal and commercial purposes – system administrators in enterprise environments can deploy it across their networks without purchasing any license. The only restriction is redistribution: you cannot repackage and sell TCPView as your own product.
- Free for personal, educational, and commercial use
- No registration, no account creation, no email required
- No ads, no telemetry, no in-app purchases
- Licensed under the Microsoft Sysinternals EULA
- Redistribution as part of the original package is permitted
Pro tip: Bookmark the Sysinternals Suite download page on Microsoft Learn. It bundles TCPView with 70+ other free system utilities that are just as useful, including Process Explorer, Autoruns, and PsExec.
Grab the latest version from our download section.
What license does TCPView use and can I use it at work?
TCPView uses the Microsoft Sysinternals Software License Terms, which is a standard Microsoft EULA. You can use it at work without purchasing any license.
The Sysinternals EULA grants you the right to use, copy, and distribute the software in its original form for any lawful purpose. This includes running it on corporate networks, on servers, on employee workstations, and in production environments. Many Fortune 500 IT departments keep the Sysinternals Suite on a network share for their support teams. Microsoft does not charge for the tools or require any kind of volume licensing agreement. The EULA does prohibit reverse engineering the binaries and using the software in ways that violate applicable laws.
- Permitted: personal use, corporate deployment, IT troubleshooting, educational use
- Permitted: placing on a shared network drive for team access
- Permitted: including in your company’s standard IT toolkit
- Not permitted: reverse engineering or decompilation
- Not permitted: rebranding and selling as a different product
Pro tip: For enterprise deployments, configure the Sysinternals Live UNC path live.sysinternals.comtools as a mapped network drive. Every employee can run the latest version of TCPView without downloading anything locally.
Learn more about getting TCPView set up at your organization in our getting started guide.
How do I download and install TCPView step by step?
TCPView does not need a traditional installation. You download a ZIP file, extract it, and run the executable directly.
The entire process takes under a minute. The download is approximately 1.5 MB, so even on a slow connection it finishes quickly. There is no installer wizard, no registry entries created, and no Start Menu shortcuts added automatically. This portable design means you can carry TCPView on a USB drive and run it on any Windows machine from Windows 8.1 onward, including Windows 10 and Windows 11. When you first launch the tool, you will see the Sysinternals EULA – click Agree to proceed.
- Visit our download section and click the download button to get the ZIP file
- Right-click the downloaded ZIP and select “Extract All” (or use 7-Zip, WinRAR)
- Open the extracted folder – you will see tcpview.exe along with tcpvcon.exe and a EULA file
- Double-click
tcpview.exeto launch the program - Accept the Sysinternals EULA on first run
- TCPView immediately starts showing all active TCP and UDP connections on your system
Pro tip: Pin TCPView to your taskbar after launching it so you can access it quickly. Right-click the taskbar icon while it is running and select “Pin to taskbar.”
For detailed configuration steps after your first launch, see our getting started guide.
Is TCPView portable or does it need an installer?
TCPView is fully portable. There is no installer. The program runs directly from wherever you extract it, and it leaves no traces when you delete the folder.
The ZIP download contains the executable files and nothing else. TCPView does not write to the Windows registry, does not create AppData folders, and does not install any background services or drivers. This makes it an ideal tool for IT support professionals who carry a USB drive with diagnostic utilities. You can copy the extracted folder to a thumb drive, plug it into any Windows machine running 8.1 or later, and launch tcpview.exe immediately. Since it writes no configuration files to disk, there is nothing to clean up afterward. The entire extracted folder is about 3.5 MB on disk, so it fits on virtually any storage device.
- No installation wizard – just extract and run
- No registry entries created or modified
- No AppData or Program Files folders used
- Runs from USB drives, network shares, or any local folder
- Extracted size: approximately 3.5 MB total
- Removal: just delete the folder
Pro tip: Create a “SysTools” folder on a USB drive and keep TCPView alongside Process Explorer and Autoruns. This gives you a portable IT diagnostic kit that works on any Windows PC without installation.
Get the portable ZIP from our download section.
How to fix TCPView not showing sent or received bytes?
If the Sent Packets, Recv Packets, Sent Bytes, and Recv Bytes columns are all blank, the issue is usually related to ETW (Event Tracing for Windows) kernel logging being stopped or interrupted.
TCPView relies on the NT Kernel Logger ETW session to track per-connection traffic statistics. If another application takes over the kernel logger session, or if a crash stops it, TCPView loses access to these counters and the columns go blank even though connections still appear. This problem is more common on Windows 11 Pro and Enterprise editions where security tools or performance monitors compete for the same ETW session. Simply closing and reopening TCPView usually does not fix it because the underlying ETW session remains in a bad state.
- Close TCPView completely
- Open Command Prompt as Administrator
- Run:
logman query -etsto check if “NT Kernel Logger” is listed - If it is missing or stopped, restart it with:
logman start "NT Kernel Logger" -p "Microsoft-Windows-Kernel-Network" 0xFFFFFFFF 0x5 -ets - If that fails, reset the network stack:
netsh winsock resetthennetsh int ip reset - Reboot your machine and relaunch TCPView as Administrator
Pro tip: Running TCPView as Administrator from the start prevents most ETW permission issues. Right-click tcpview.exe and select “Run as administrator” every time, or set it permanently in the Properties compatibility tab.
If you continue having issues, review the full setup steps in our getting started guide.
Why does TCPView show many TIME_WAIT connections?
Seeing many TIME_WAIT connections in TCPView is normal. TIME_WAIT is a standard TCP state that happens after a connection closes, and it lasts about 4 minutes by default on Windows.
When a TCP connection is closed, the operating system keeps the socket in TIME_WAIT to handle any delayed packets that might still arrive on the network. On a busy machine running a web browser with many tabs, you might see dozens or even hundreds of TIME_WAIT entries at any given moment. Each one represents a recently closed connection. Chrome, Edge, and Firefox are common sources because they open and close many short-lived HTTPS connections while loading web pages. This is not a sign of malware or a network problem. TCPView highlights these in yellow when the state changes, which can make them look alarming if you are not used to seeing them.
- TIME_WAIT duration on Windows: approximately 240 seconds (4 minutes) by default
- Common sources: web browsers, Windows Update, Microsoft Teams, Outlook
- Not harmful: this is standard TCP/IP behavior defined in RFC 793
- High counts from a single app could indicate a connection leak in that application
- Use Options > Filter to hide resolved TIME_WAIT entries if they clutter the view
Pro tip: If a specific application is creating an unusual number of TIME_WAIT connections (thousands per minute), that application might have a connection pooling bug. Use TCPView’s process filter to isolate it, then report the issue to that software’s developer.
Learn more about TCPView’s color coding and connection states on our features page.
TCPView stopped working after a Windows update – how do I fix it?
If TCPView crashes, fails to launch, or shows errors after a Windows update, the fix is almost always to download the latest version. Older builds can break when Microsoft changes internal networking APIs.
Microsoft occasionally updates the kernel-level networking structures that TCPView reads from. When a major Windows update (like going from 23H2 to 24H2) changes these internal data formats, older TCPView versions might crash on launch or display corrupted data. Version 4.19 (the latest as of 2024) supports all current Windows 10 and Windows 11 releases. If you have been running an older version like 3.x or 4.0, upgrading to 4.19 will fix compatibility issues. Since TCPView is portable, upgrading is just a matter of downloading the new ZIP and replacing the old files.
- Delete or rename your current TCPView folder (keep as backup if you want)
- Download the latest version from our download section
- Extract the new ZIP to your preferred location
- Launch the new tcpview.exe – accept the EULA again if prompted
- If it still crashes, try running it in compatibility mode for Windows 10
Pro tip: Set a calendar reminder to check for Sysinternals updates every few months. The tools are updated without fanfare, and running the latest version prevents most compatibility headaches after Windows patches.
Check our system requirements to confirm your Windows build is supported.
How do I update TCPView to the latest version?
TCPView does not have a built-in auto-update feature. To update, download the latest ZIP from the official source and replace your existing files.
The current version is 4.19. Since TCPView is a portable application that does not use an installer, updating is straightforward: download the new ZIP, extract it, and replace your old tcpview.exe with the new one. You do not lose any settings because TCPView does not save configuration files between sessions – it starts fresh every time. If you installed TCPView through the Microsoft Store, updates are handled automatically through the Store’s update mechanism. For users who prefer the standalone download, there is no notification when a new version comes out. You can monitor the Sysinternals Blog on Microsoft Tech Community for announcements about updates.
- Check your current version by running TCPView and looking at the title bar
- Visit the official Sysinternals download page or our download section
- Download the latest ZIP (currently v4.19, about 1.5 MB)
- Close TCPView if it is running
- Extract the new ZIP over your existing folder, replacing the old files
- Relaunch – no EULA prompt if you already accepted previously
Pro tip: Subscribe to the Sysinternals Blog RSS feed at techcommunity.microsoft.com to get notified when any Sysinternals tool gets updated. Updates often coincide with major Windows releases.
For the current download, visit our download page.
What is new in the latest version of TCPView?
TCPView 4.19 is the latest release. The 4.x series brought a complete UI redesign, dark mode support, and per-connection traffic statistics that were not available in the older 3.x builds.
The jump from version 3.x to 4.0 (released in early 2021) was the biggest update in TCPView’s history. Microsoft rebuilt the interface using modern Windows UI components, added columns for Sent Packets, Received Packets, Sent Bytes, and Received Bytes, and introduced a toolbar for filtering by connection state. Version 4.19 refined these features with bug fixes and improved stability on Windows 11. The visual refresh also added proper high-DPI support, so the interface scales cleanly on 4K monitors and displays using 200% or higher scaling. The older 3.x versions are still floating around on some download sites, but they lack the traffic statistics columns and have compatibility issues with recent Windows builds.
- v4.0+: complete UI redesign with modern Windows look
- v4.0+: Sent/Received packets and bytes columns
- v4.0+: connection state filtering in the toolbar
- v4.0+: high-DPI and multi-monitor improvements
- v4.19: stability fixes and Windows 11 24H2 compatibility
Pro tip: If you see TCPView version 3.x on a download site, skip it. Always get version 4.19 for the per-connection traffic tracking alone. It is far more useful for diagnosing bandwidth-hogging processes.
Download the latest version from our download section.
TCPView vs CurrPorts – which network monitor is better?
Both TCPView and CurrPorts are excellent free network monitors, but they suit different needs. TCPView is better for real-time monitoring with its auto-refresh and color-coded display. CurrPorts is stronger for filtering, exporting, and static analysis.
TCPView, developed by Microsoft, refreshes its display every 1 second by default and highlights new connections in green, closed ones in red, and changed ones in yellow. This makes it excellent for watching network activity happen live. CurrPorts, made by Nir Sofer at NirSoft, does not auto-refresh by default and focuses more on detailed static snapshots. CurrPorts shows additional columns that TCPView lacks, including the module filename, the product name, and the file version of the process owning each connection. It also has more powerful filtering with the Advanced Filters dialog, and it can export data to HTML, CSV, XML, and tab-delimited text files.
- Real-time monitoring: TCPView wins with 1/2/5-second auto-refresh and color coding
- Filtering and search: CurrPorts wins with its Advanced Filters and column sorting
- Data export: CurrPorts wins with HTML, CSV, XML, and text export options
- Process details: CurrPorts shows more metadata per connection (module path, product name)
- Closing connections: both tools let you close TCP connections via right-click
- Developer trust: TCPView is from Microsoft; CurrPorts is from NirSoft (equally well-regarded)
Pro tip: Many IT professionals keep both tools on their USB drive. Use TCPView when you need to watch connections happening in real time, and switch to CurrPorts when you need to filter, sort, or export connection data for a report.
See everything TCPView can do on our features page.
How do I use the Tcpvcon command-line tool included with TCPView?
Tcpvcon is a command-line version of TCPView that comes in the same ZIP download. It outputs the same connection data to the console or to a file, which makes it useful for scripting and automation.
While TCPView gives you a graphical interface, Tcpvcon prints the same endpoint information as text output. This is useful when you need to capture a snapshot of all connections on a server, pipe the output to a log file, or parse it with a script. The output format matches what you see in the TCPView GUI columns: process name, PID, protocol, local address, local port, remote address, remote port, and connection state. You can filter the output to show only TCP connections, only UDP endpoints, or only listening ports.
- Open Command Prompt or PowerShell as Administrator
- Navigate to the folder where you extracted TCPView
- Run
tcpvcon -ato display all endpoints (TCP and UDP) - Run
tcpvcon -cto output in CSV format for easy parsing - Run
tcpvcon -nto skip DNS name resolution (faster output) - Combine flags:
tcpvcon -a -c -n > connections.csvto save all connections as CSV
Pro tip: Create a scheduled task that runs tcpvcon -a -c -n > C:logsconnections_%date%.csv every hour. This builds a log of all network connections over time, which is invaluable for post-incident forensics or tracking down intermittent network issues.
Learn the basics of both tools in our getting started guide.
How do I close a connection or kill a process in TCPView?
Right-click any connection in TCPView to close it or to terminate the process that owns it. Closing a connection resets that specific TCP socket. Killing the process ends the entire application.
TCPView gives you two distinct options in the right-click context menu. “Close Connection” sends a TCP RST (reset) packet to terminate just that one socket without affecting the parent process. This is useful when an application has a stuck or hung connection but is otherwise working fine. “End Process” calls TerminateProcess on the PID that owns the connection, which kills the entire application immediately without giving it a chance to save data. There is also a “Process Properties” option that opens the file location of the executable. Use these with caution on production systems since closing a database connection or killing a service process can cause data loss.
- Find the connection you want to act on in the TCPView list
- Right-click on the row to open the context menu
- Select “Close Connection” to reset only that TCP socket
- Or select “End Process” to terminate the entire application
- Use “Whois…” to look up the remote IP address if you need to identify where the connection goes
Pro tip: Before killing a process, use “Process Properties” from the right-click menu to verify which executable owns the connection. Sometimes system services like svchost.exe host multiple services, and killing it can crash other unrelated functionality.
For a complete walkthrough of TCPView’s interface, visit our getting started guide.
Does TCPView work offline without an internet connection?
Yes, TCPView works completely offline. It monitors your system’s local TCP/IP stack directly and does not need internet access to function.
TCPView reads connection data from the Windows kernel’s networking tables, not from any external server. You can run it on an air-gapped machine, a server behind a firewall, or a laptop in airplane mode. The only feature that requires internet access is the Whois lookup, which queries external WHOIS servers to identify who owns a remote IP address. If you are offline, the Whois button simply will not return results. DNS name resolution (the Resolve Addresses toggle, toggled with Ctrl+R) also requires network access if the DNS server is remote, but on a domain-joined machine, cached DNS entries will still resolve. Everything else – process names, PIDs, protocols, ports, connection states, and traffic counters – works without any network connectivity.
- Core monitoring: works fully offline
- Whois lookup: requires internet access (optional feature)
- DNS resolution: works with cached entries; remote DNS needs connectivity
- Traffic statistics (sent/recv bytes): works offline
- No license activation or phone-home check required
Pro tip: When working on an isolated network, turn off address resolution by pressing Ctrl+R. This speeds up the display and prevents TCPView from trying to look up hostnames for every connection, which would time out and slow down the interface on air-gapped systems.
See the complete feature list on our features page.
Still have questions? Check the Getting Started guide or download TCPView to try it yourself.